Doppler Effect – EN
Doppler effect
It refers to the variation in frequency noticed by an observer when the distance between him and a wave source is increasing or decreasing.
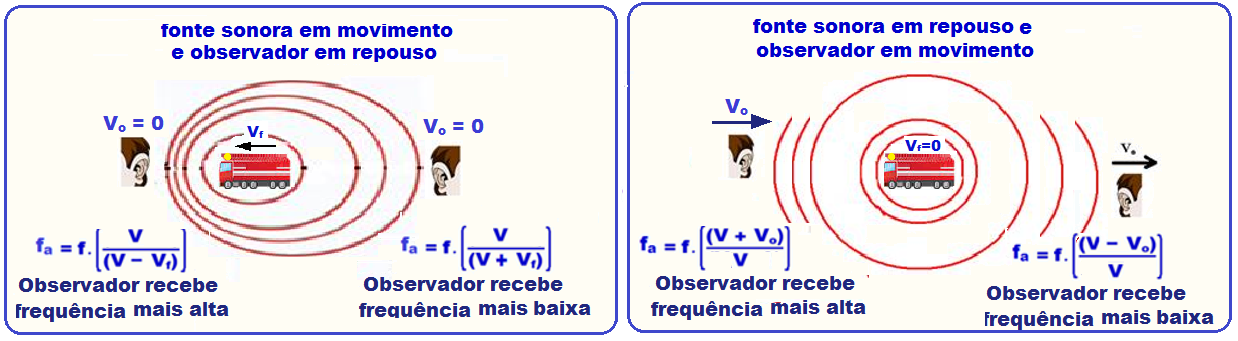
When the source and observer come closer together, the latter will perceive the sound emitted by the source as higher pitched (higher frequency, receives a greater number of wave fronts in the unit of time) than it would perceive if the source and observer were stationary.
In this case, the apparent wavelength perceived by the observer will be smaller than the wavelength emitted by the source (observer O 1 in the figures below).
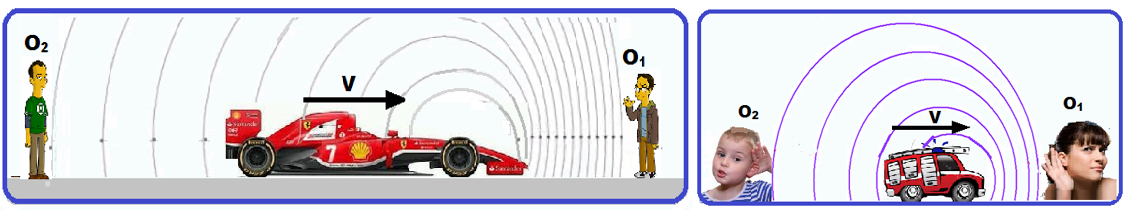
When the source and observer are far apart, the latter will perceive the sound emitted by the source as lower (lower frequency, receives fewer wave fronts in the unit of time) than they would if the source and observer were stationary.
In this case, the apparent wavelength perceived by the observer will be greater than the wavelength emitted by the source (observer O2 in the figures above).
Note that the ambulance driver does not notice any change in the sound emitted by the siren as they move together.
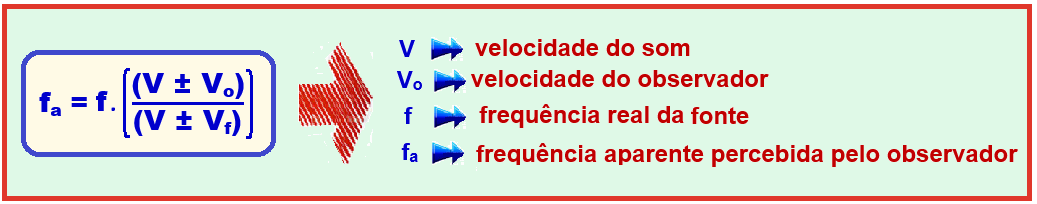
If we call V the speed of sound, V f the speed of the source, V o the speed of the observer, f the real frequency emitted by the source , the apparent frequency f a perceived by the observer will be given by the expression:
Rule of signs
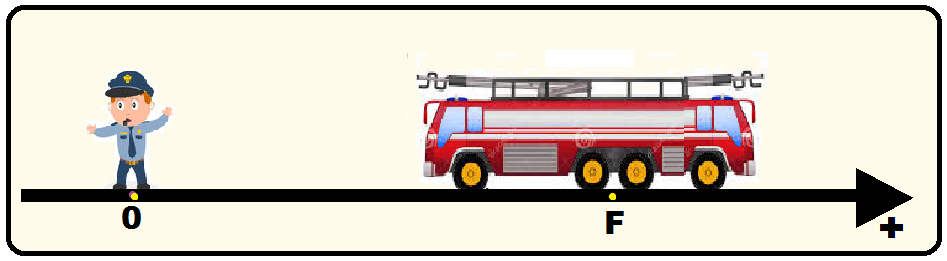
By directing the observer’s trajectory towards the source , the signs of V o and V f will be positive in favor of this
guidance and negatives against that guidance.
Carefully analyze the examples of the signal rules given below:
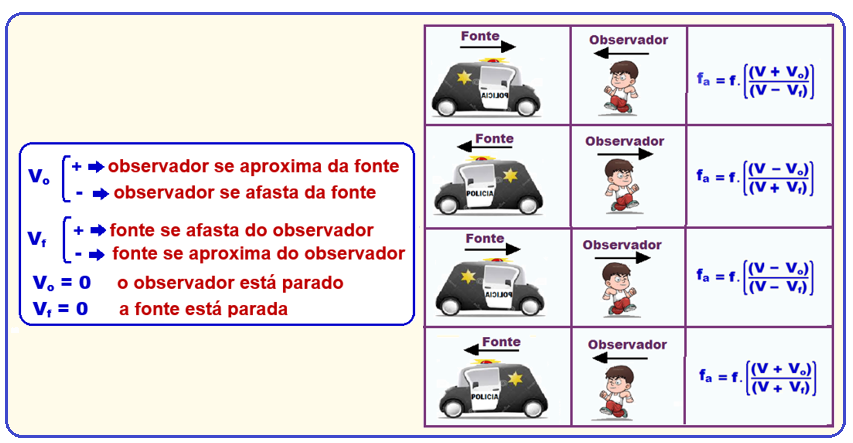
If observer or source is at rest:
Doppler effect for movements in any direction
In the above studies we assumed that the source and the observer were in the same direction of motion.
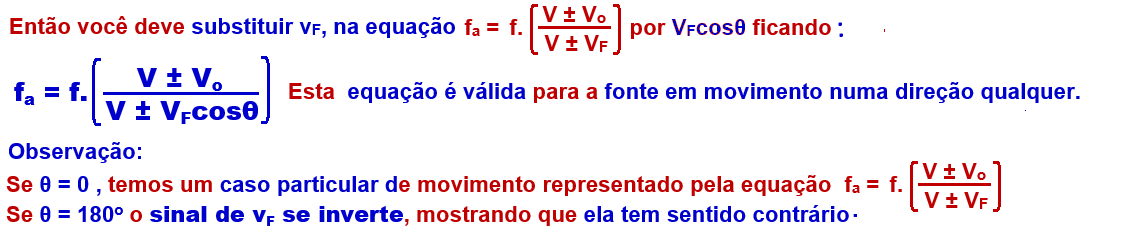
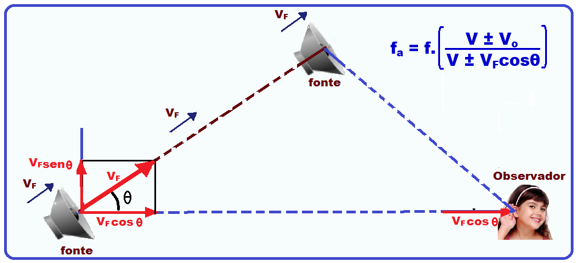
But the source can move in a direction that forms an angle θ with the direction connecting the source to the observer, as in the figure.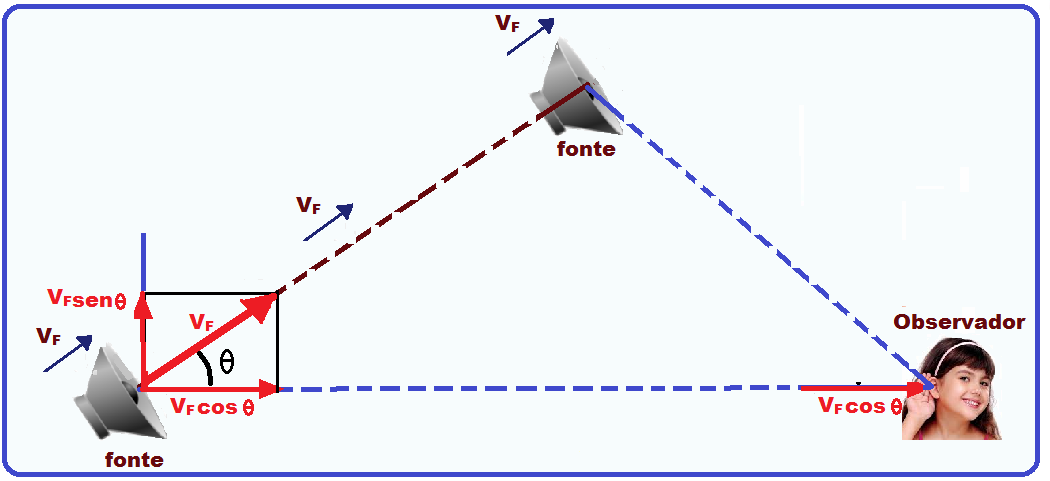
Only the component of velocity in the direction of the observer contributes to the Doppler effect.
What you should know, information and tips
![]()
Rule of signs
By directing the observer’s trajectory towards the source , the signs of V o and V f will be positive in favor of this
guidance and negatives against that guidance.
Doppler effect for movements in any direction
![]()
Beat frequency – Sound interferenceSound interference
Beat frequency occurs when two or more sound waves overlap at the same point.
Let us suppose two sound waves of slightly different frequencies , one of f A = 100Hz and the other of f B = 110Hz.
Then you will hear a loud sound (constructive interference) and then a soft sound (destructive interference) and so on. This phenomenon is called debating (figure).
Note that the resulting wave presents points where the amplitude is maximum (loud sounds, constructive interference) as in points A, C and E , it decreases and practically disappears or is cancelled out (destructive interference) as in points B, D and F.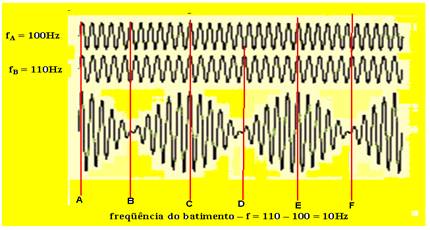
The beat frequency is defined as f beat = f major – f minor .
The phenomenon of beating is often used in the tuning of musical instruments. If the frequencies of the tuning source and the instrument are different, a beating sound is heard. The frequency of the beating sound decreases as the instrument is tuned , and when it disappears, the instrument is in tune .
Uses of the Doppler Effect
![]() In medical diagnostics, ultrasound or sonography is a diagnostic method that uses the echo produced by sound to see in real time the shadows produced by the body’s structures and organs .
In medical diagnostics, ultrasound or sonography is a diagnostic method that uses the echo produced by sound to see in real time the shadows produced by the body’s structures and organs . ![]()
Ultrasound devices generally use a frequency close to 1 MHz, emitted by a sound source placed in contact with the skin and receiving the generated echoes, which are interpreted through computer graphics.
Depending on the density and composition of the body’s internal structures, the attenuation and phase shift of the emitted signals varies, making it possible to translate them into a gray scale, which will form the image of the internal organs.

However, there is ultrasound equipment that, in addition to images, allows the evaluation of blood movement speeds.
This equipment compares the frequency of the emitted ultrasound with the frequency of the reflected ultrasound and, through the Doppler Effect, determines the displacement speeds, knowledge of which is very important information for medical diagnoses in the following areas:
![]() Study of arteries and veins;
Study of arteries and veins;
![]() Detection of venous or arterial thrombosis;
Detection of venous or arterial thrombosis;
![]() Arterial stenoses and/or occlusions;
Arterial stenoses and/or occlusions;
![]() Aneurysms;
Aneurysms;
![]() Preoperative mapping of varicose veins;
Preoperative mapping of varicose veins;
![]() Pregnancy for measuring maternal-fetal blood flow;
Pregnancy for measuring maternal-fetal blood flow;
![]() Diseases of the renal arteries (narrowings, obstructions and dilations).
Diseases of the renal arteries (narrowings, obstructions and dilations).
![]() The operation of Doppler radar is based on the movements of the objects. The device emits an electromagnetic wave with a continuous and constant frequency (f’).
The operation of Doppler radar is based on the movements of the objects. The device emits an electromagnetic wave with a continuous and constant frequency (f’).
If the moving body (e.g. automobile) in question is moving towards the source, the radar receiver will identify an increase in frequency (f”).
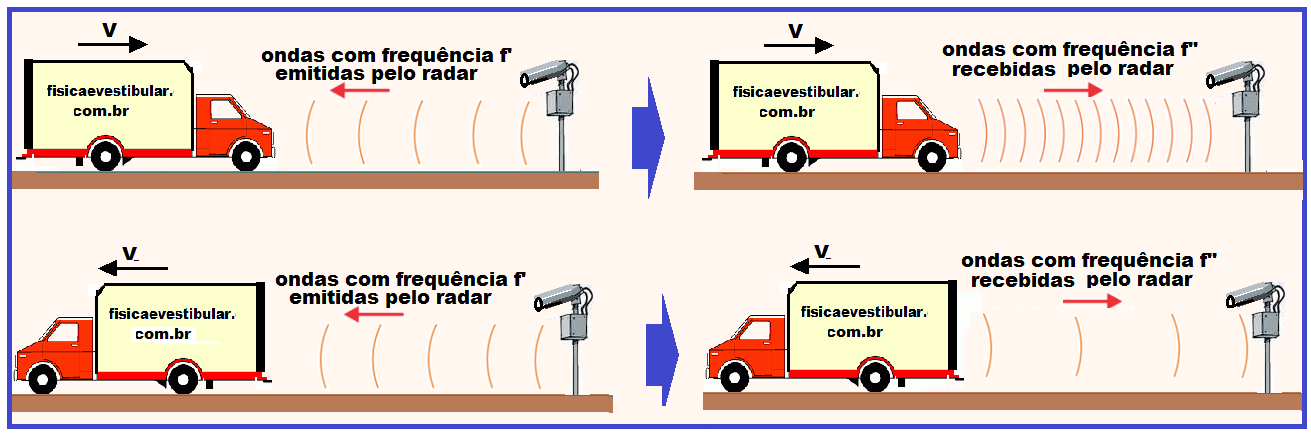
The difference between the emitted (f’) and reflected (f”) frequencies will be translated by the decoder in the radar as a speed value.
This type of radar also works when the vehicle is moving away.
Again, what is at stake is the difference between the emission and reception frequencies , which allow us to evaluate the speed of the reflecting surface.
Air traffic control uses radar to track planes on the ground and in the air, and also to guide pilots to make smooth landings.
NASA uses them to map the Earth and other planets, to track satellites and space debris, and to help maneuver its aircraft.
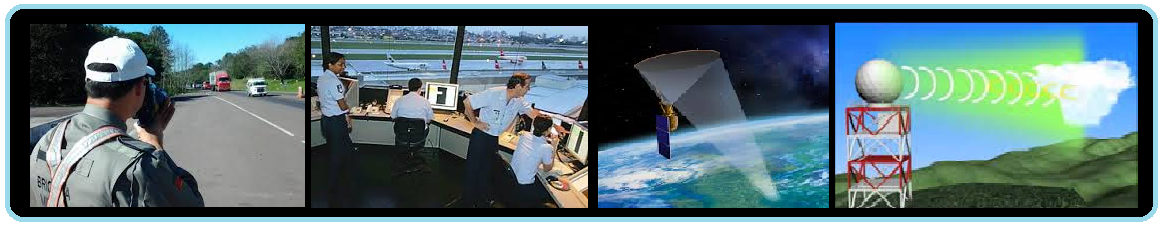
Meteorologists use radar to track storms, hurricanes , and tornadoes .
Even the device that makes store doors open automatically is a type of radar.
![]() The Doppler effect is also valid for light (transverse electromagnetic wave).
The Doppler effect is also valid for light (transverse electromagnetic wave).
Thus, the frequency of light increases (the color of light tends towards blue ) when the observer-source distance is decreasing and decreases (the color of light tends towards red ) when the observer-source distance is increasing . The relative velocity between the observer and the source is very large.
Thus, due to the Doppler effect, the colors of a star’s electromagnetic spectrum appear
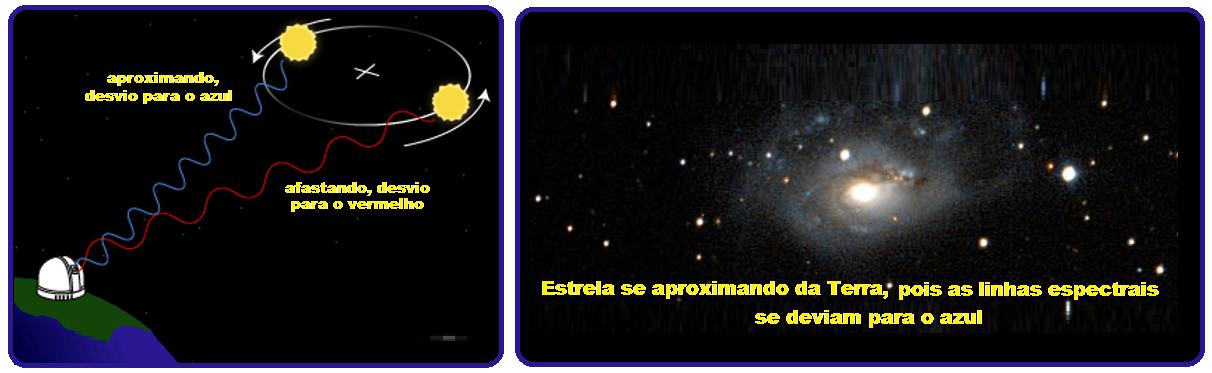
shifted to the red, if the observed star is moving away , or shifted to the blue, if the star is approaching us.
In astronomy, the Doppler effect is used to measure the relative speed of stars and other luminous celestial bodies in relation to Earth.
These measurements led scientists to conclude that the universe is expanding, as the color of these luminous celestial bodies shows a greater red shift, which indicates that the distance between them and us is increasing.
![]() If you want, you can check the solutions of some exercises that may be useful and that I selected
If you want, you can check the solutions of some exercises that may be useful and that I selected ![]() are the numbers, 04, 09, 11, 16, 17, 19 and 29.
are the numbers, 04, 09, 11, 16, 17, 19 and 29.
![]()
See the resolution of some interesting exercises:
01-(FUVEST-SP) A sound wave considered flat, coming from a siren at rest, propagates in still air, in the horizontal direction, with a speed V equal to 330 m/s and a wavelength equal to 16.5 cm.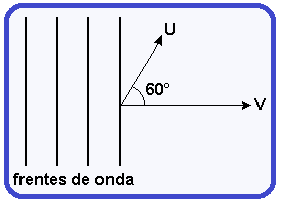
In the region where the wave is propagating, an athlete runs, on a horizontal track, at a speed U equal to 6.60 m/s, forming an angle of 60° with the direction of propagation of the wave .
Determine the approximate frequency of the sound heard by the athlete.
Resolution:
The wave propagation speed V and the observer (receiver) speed U must be in the same direction.
Only the horizontal component (U x ) of the observer’s velocity (U) influences the movement , since the wave fronts are flat, propagating horizontally and to the right. Note that the vertical component of U does not reach the observer and you must consider only the component on the line that connects the observer to the source: (see figures).
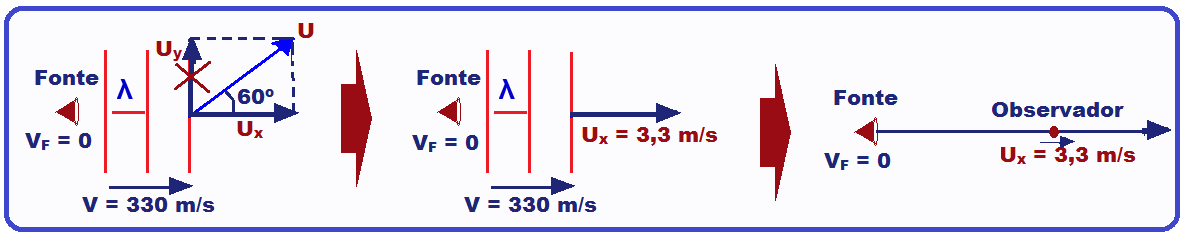
Projecting U in the direction of V ![]() U x = Ucos60 o U x = 6.6.0.5 U x = 3.3 m/s.
U x = Ucos60 o U x = 6.6.0.5 U x = 3.3 m/s. ![]()
![]()
Calculation of the source frequency using the fundamental wave equation ![]() V = λf
V = λf ![]() 330 = 0.165f
330 = 0.165f ![]() f = 2,000Hz.
f = 2,000Hz.
The source speed is zero , since the siren is at rest V F = 0 ![]()
Calculation of the apparent frequency perceived by the athlete using the Doppler effect expression f a = f.(V ± V o )/(V ± V F ) f a =2000(330-3.3)/(330 – 0) f a = 653,400/330 f a = 1,980 Hz ![]()
![]()
![]()
![]()
Note: You would get the same result if you projected V in the direction of U.
02- (UFJF-MG) A security alarm, which is fixed, is activated, producing a sound with a frequency of 735 Hz.
Consider the speed of sound in air to be 343 m/s . When a person drives a car toward the alarm and then away from it at the same speed, he observes a change in frequency of 78.4 Hz.
a) Is the frequency heard by the person when he approaches the siren higher or lower than what he would hear if he were standing still? Justify.
b) What is the speed of the car?
Resolution:
a) Greater. As the person approaches the source, he observes an increase in the number of wave fronts passing by him per unit of time in relation to the situation in which the person is standing still, implying an increase in frequency.
b) Approaching ![]() f 1 = 735(343+V)/343
f 1 = 735(343+V)/343 ![]() f 1 = 735 + 2.1V
f 1 = 735 + 2.1V
Moving away ![]() f 2 = 735(343-V)/343
f 2 = 735(343-V)/343 ![]() f 2 = 735-2.1V
f 2 = 735-2.1V
The change (variation) of frequency is given Δ f = 78 Hz ![]() Δ f = f 1 – f 2 78 = 735 + 2.1V – (735-2.1V) 78 = 735+2.1V – 735 +2.1V V = 18.6 m/s
Δ f = f 1 – f 2 78 = 735 + 2.1V – (735-2.1V) 78 = 735+2.1V – 735 +2.1V V = 18.6 m/s ![]()
![]()
![]()
03- Traveling at a speed of 144 km/h on a road, a highway police vehicle , in pursuit, sounds the siren, the sound of which has a frequency equal to 1500 Hz .
A woman standing at a point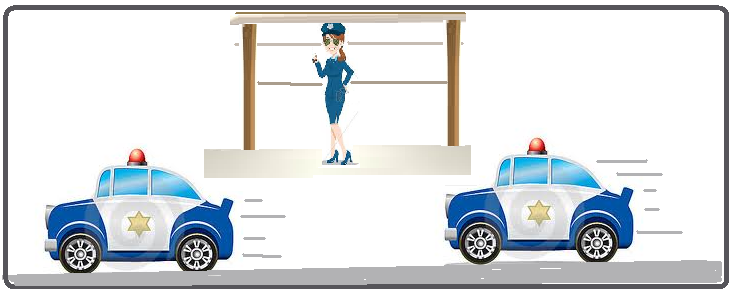
by bus, on the same road, notices a sudden variation in the sound, at the moment the vehicle passes the point where she is. What is the approximate frequency variation, in Hz, heard by the woman, taking as a parameter the periods before and after the vehicle passes?
Adopt the speed of sound V s = 340 m/s
Resolution:
Source approaching woman f a = 1500(340 + 0)/(340 – 40) = 1500.340/300 f a = 1700Hz ![]()
![]()
Source moving away from woman f a = 1500(340 + 0)/(340 +40) = 1500.340/380 f a = 1342.6Hz ![]()
![]()
Δf = 1700 – 1342 = 358Hz.
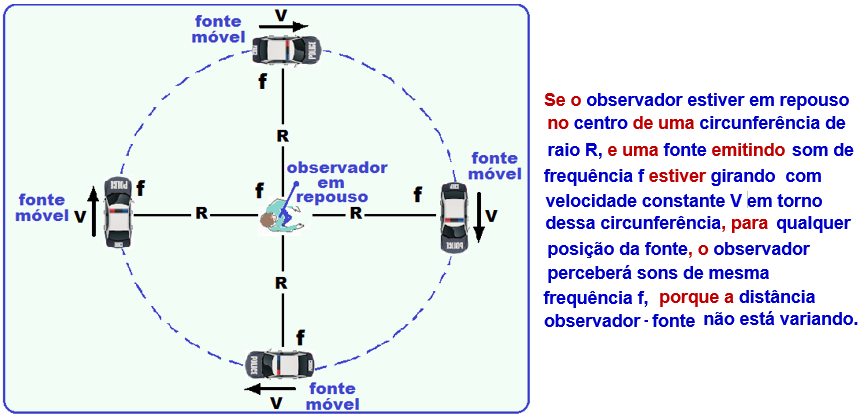
03- (ITA-SP) A young woman sits on the seat of a circular carousel that rotates at a speed
constant angular with period T.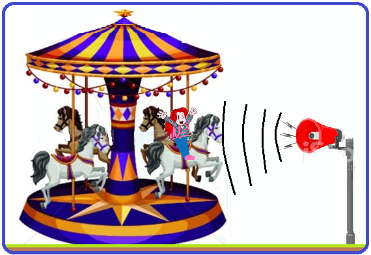
A siren positioned outside the carousel emits a sound of frequency f o towards the center of rotation.
At time t = 0, the young woman is at the shortest distance from the siren.
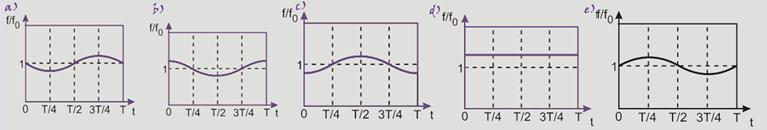
In this situation, indicate the best representation of the frequency f heard by the young woman.
Observe the diagram in the figure below:
![]() At instant t = 0 the young woman (listener or observer) is in the position shown in the figure
At instant t = 0 the young woman (listener or observer) is in the position shown in the figure ![]() at this point, the frequency heard (f ) is equal to the frequency of the siren (f o ) “receives the same amount of waves as those emitted by the siren, even λ” such that f/f o = 1 (f = f o ).
at this point, the frequency heard (f ) is equal to the frequency of the siren (f o ) “receives the same amount of waves as those emitted by the siren, even λ” such that f/f o = 1 (f = f o ).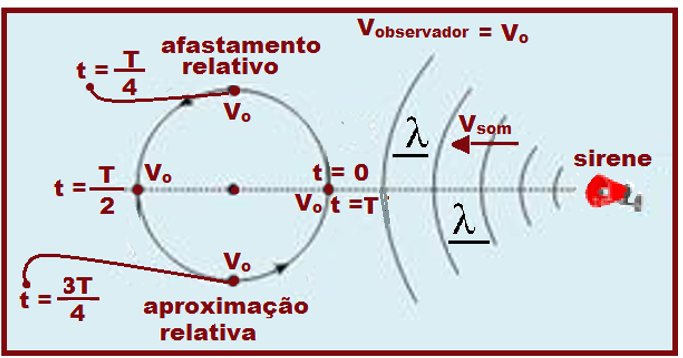
![]() From that moment on, until T/2, there is a relative distance between the young woman and the siren, so that the frequency heard by her is lower than the frequency emitted by the siren f/f o <1 (f < f o ).
From that moment on, until T/2, there is a relative distance between the young woman and the siren, so that the frequency heard by her is lower than the frequency emitted by the siren f/f o <1 (f < f o ).
![]() at instant t = T/2, it hears the frequency emitted by the source again (it receives the same amount of waves as those emitted by the siren, even λ) such that f/f o = 1 (f = f o ).
at instant t = T/2, it hears the frequency emitted by the source again (it receives the same amount of waves as those emitted by the siren, even λ) such that f/f o = 1 (f = f o ).
![]() From T/2 to T, there is a relative approximation between the young woman and the siren and she begins to perceive a frequency higher than that emitted by the siren f/f o > 1 (f > f o ).
From T/2 to T, there is a relative approximation between the young woman and the siren and she begins to perceive a frequency higher than that emitted by the siren f/f o > 1 (f > f o ).
Note that the maximum speeds of separation and approach occur at t = T/4 and at t = 3T/4, instants at which f/f reaches minimum and maximum values, respectively R- A ![]()